


HOUSTON, Texas – The modern use of a multitude of downhole petrophysical tools generates an enormous amount of information, of which only a tiny fraction is of any use. To try to make sense of this flood of data, log analysts have created a plethora of crossplots. A crossplot is a graph that plots values of at least two variables at identical depths. For example, a plot may be constructed of density log readings versus neutron log readings, as show below.
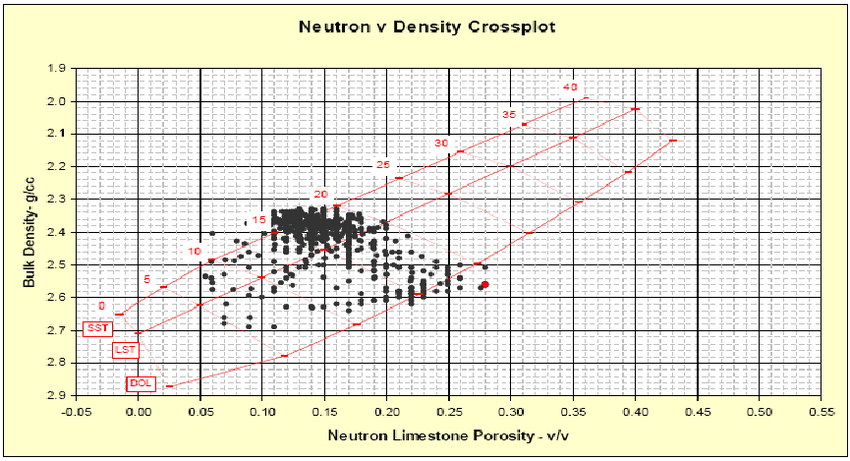
Depending on the type of data, the scales may be linear, logarithmic or semi-logarithmic. SPWLA (Society for the Prevention of Well Log Analysis) released its long-awaited research paper on scaling of crossplots. The principal conclusion of the study is that the scale doesn’t matter. The crossplot is going to look like an amorphous blob regardless. The objective is to derive average values for reservoir rock characteristics through curve-fitting. Methods of curve-fitting ranges from the popular least-squares method to the rare most-circles method.
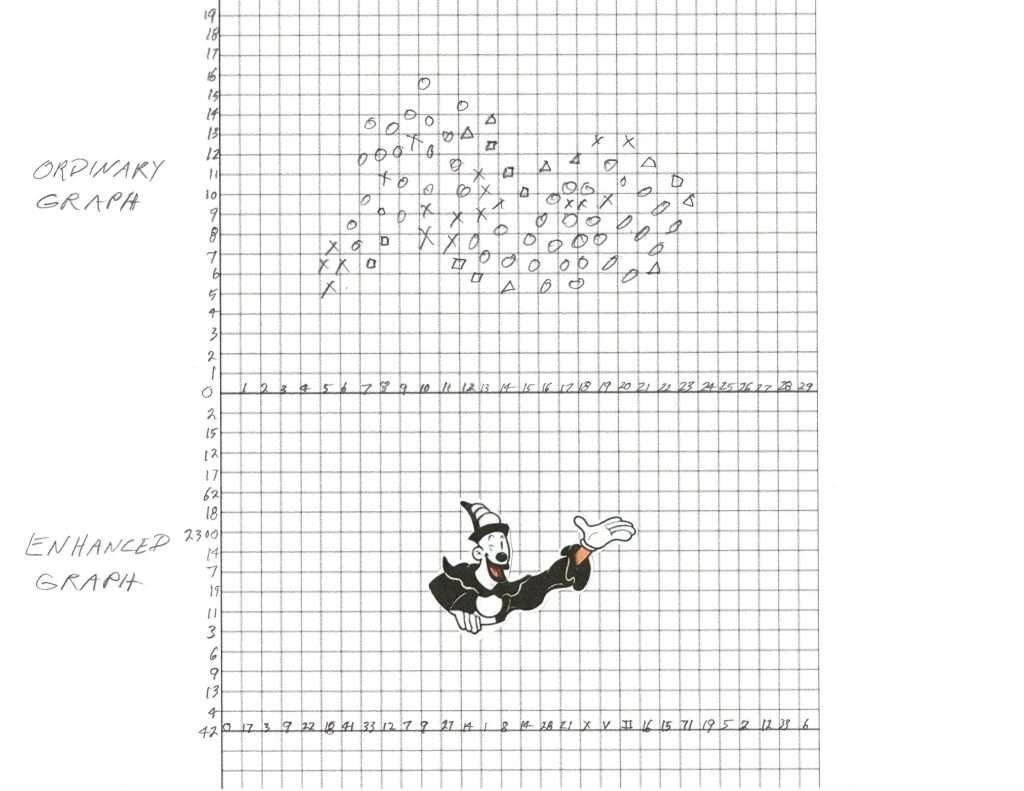
The great innovation that SPWLA is proposing is that the values on the two axes of the graph are not sequential numbers but rather placed by a random number generator. That is, instead of the x-axis and/or the y-axis being scaled 1, 2, 3, 4…, it is e.g. 7, 42, 1, 13. This process is easily achieved using a computer. Results of crossplots using this process are far more interesting than ordinary crossplots. The programming is in progress so the image below is a hand-drawn mock-up of how the new enhanced crossplot would work.
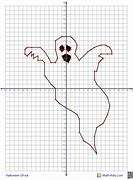
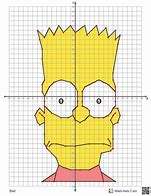
Log analysis is incredibly boring work and SPWLA is doing its best to make it interesting to the larger oil and gas community and hopefully preserve their jobs. A few preliminary hand-created results of the new technique are shown below.